


Getting into Data science can be an overwhelming track to navigate, there's an overload of information out there, filtering out the necessary information and dropping the unnecessary can be very demanding. I am in no way an expert but but very proficient in my skills, I am writing this article to make this information more easily streamlined for beginners and enthusiast.
I am also still learning, still figuring ways to overcome hurdles, getting better and sharing this article as a way to reinforce my skills and help anyone considering Data science as a career but also making this an interesting read for anyone.
It's boggling especially if you can't find the right resources to acquire the fundamentals skills. Strong background in fundamental knowledge in my experience usually determines how good you get at anything.
The goal is to make this article as simple and easy for anyone to grasp the content. Strong fundamentals is a major prerequisite for a better programmer and this applies to all worldly professions.
I will be radiating more insights into how to perform a simple Linear Regression Task and explain the important concepts to take note of along the line. I will make it explicitly simple for beginners, curious enthusiasts and non data scientist to grasp an idea about what's being portrayed in this article. Firstly let's commence with some definitions, so that everyone gets carried along .
What is machine learning?
Machine learning is the process of teaching a computer system how to make accurate predictions when fed data.
Types
The Major types of machine learning Supervised Learning Unsupervised Learning
What is Supervised learning?
We would be looking at only concepts on supervised learning, to be specific Linear regression. Supervised learning is an algorithmic task written to train a model using labelled examples (Features),a situation where the inputs as well as the desired outputs are known. Commonly used in applications where past data predicts likely future events.
Types
The Major types of Supervised learning
Classification
Regression
Use cases in real world scenarios
- Fraud detection.
- Web search results.
- Image and voice recognition
- Credit scoring.
- Real-time chatbot agents.
- Product recommendations.
- Equipment Failure.
- Healthcare (detection of disease)Etc.
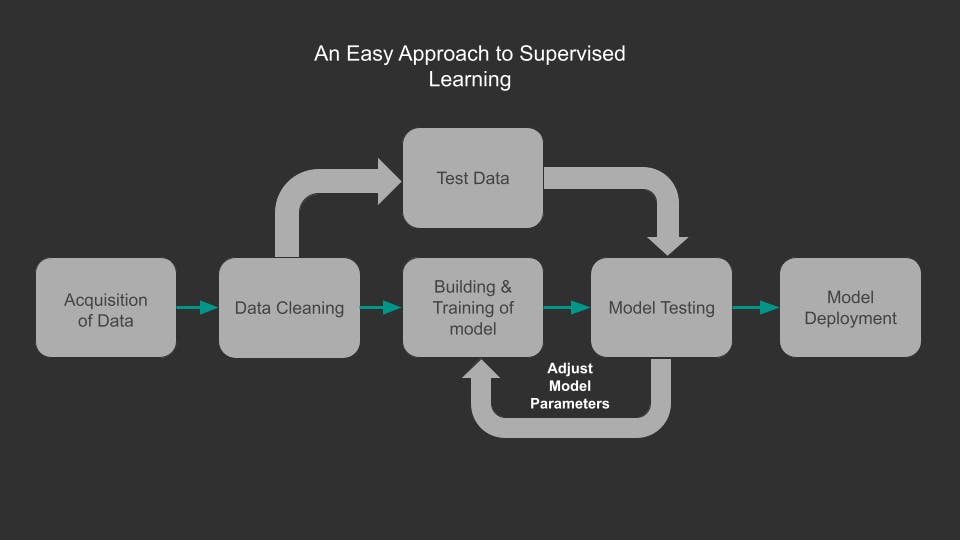
Data Acquisition
Acquire and Prepare your data, it could be from an Application, customer survey, sensors, online etc.
Data Cleaning
This where we clean, format and fill missing information on the data to a preferable standard using pandas (pandas is a software library written for the Python programming language for data manipulation and analysis)
Building and Training of model
We split our data into test and training data, but for best practice we are encouraged to split into three sets namely test, validation and training datasets because it's better to build and adjust your model parameters with training and validation datasets until a perfect fit is achieved.
Model Testing
All our data splits including test data go through this phase but that's after we have adjusted our model parameters to fit our training and validation datasets, then use our test data on the model.
Model Deployment
Model should be deployed after we are satisfied with our final performance metric using test data.
A short recap
Training Data
Used to train model parameters
Validation Data
Used to determine what model parameters to adjust
Test Data
Used to get some final performance metric
REGRESSION
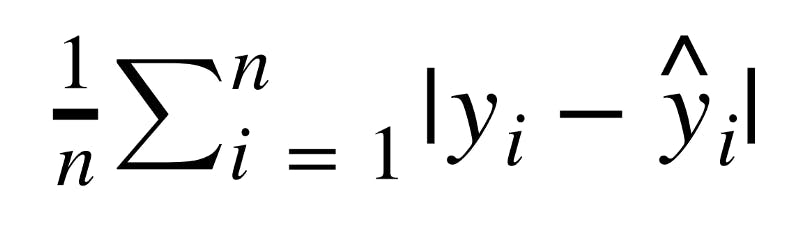
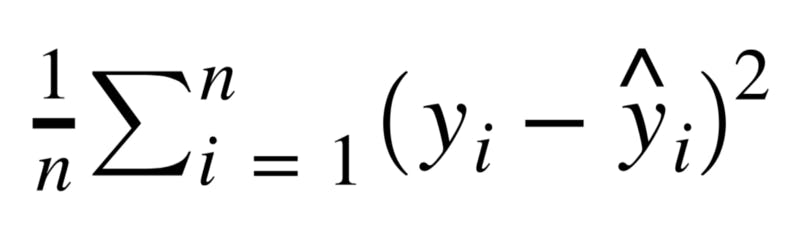
A regression task is a supervised learning model that predict continuous or quantitative values Eg Predicting the salary of an individual based on some quantitative features in the datasets, Prediction of house prices using its features. It's a known fact that the core of machine learning is centered on statistical methods, while some might argue that you don't need statistical knowledge to perform machine learning tasks but I will assert that possessing strong fundamentals is enough to enable you to solve real-world problems with machine learning. For regression tasks we have 3 common statistical performance evaluation metrics namely
Mean Absolute Error (MAE) is the mean of the absolute value of the errors:
Mean Squared Error (MSE) is the mean of the squared errors:
Root Mean Square Error(RMSE) is the square root of the mean of the squared errors:
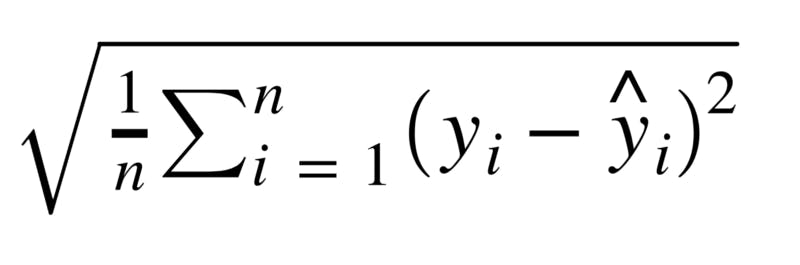
We will see how to use these statistical equations to evaluate our model performance where yi is our historical test data value for the label while ŷi is the predictions generated by our model. After we have acquired our dataset and prepared it for cleaning and Analysis, we will then go ahead and install the Scikit-Learn . Scikit-learn (Sklearn)is a useful and robust library for machine learning in Python. It provides a selection of efficient tools for machine learning and statistical modeling, for those using their command line interface simply paste this 'pip install scikit-learn' while those using anaconda should paste this into their interface 'conda install scikit-learn', after installation we will go ahead and import the library in our IDE . A software library is a suite of data and programming code that makes development of software programs and applications easier.
LINEAR REGRESSION
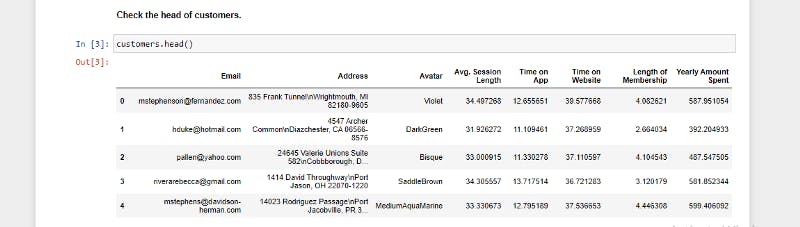
For the sake of this article we would be using fake ecommerce data from a New York City online clothing store but they also have in-store style and clothing advice sessions. Customers come into the store, have sessions/meetings with a personal stylist, then they can go home and order either on a mobile app or website for the clothes they want.
PROBLEM STATEMENT
The company is trying to decide whether to focus their efforts on their mobile app experience or their website. We'll work with the Ecommerce Customers csv file from the company. It has information which are categorical columns such as
- Address
- color
- Avatar
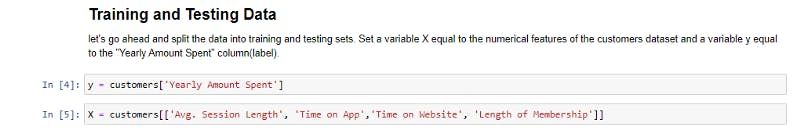
Then it also has numerical/continuous columns (Features):
- Avg. Session Length: Average session of in-store style advice sessions.
- Time on App: Average time spent on App in minutes
- Time on Website: Average time spent on Website in minutes
- Length of Membership: How many years the customer has been a member.
And the continuous column we are predicting (label):
- Yearly Amount Spent
we will take a peak at the table and view some of the information:
First step:
Dropping all categorical columns and Splitting the numerical columns into features (X) and label (y)(historical data we are trying to predict)
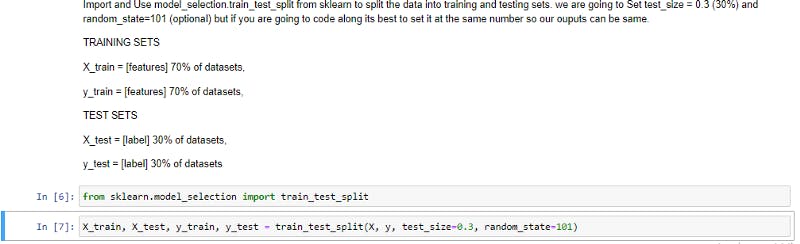
Second step:
We will import train_test_split from sklearn_model_selection to split the dataset into training and test data, usually for best practice 30% - 33% of the dataset should be allocated to the test data and at least 70% to the training data. This is done by specify the test_size argument be set between 0 to 1 eg 0.3 = 30%
Third step:
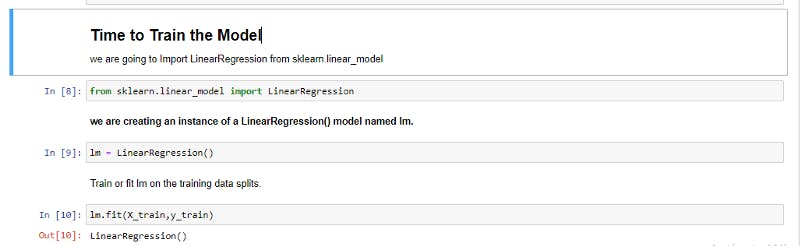
Importing and instantiating the linear regression model, then we fit our instantiated object and fit(train) our training data with the features(X_train) and label(y_train).
Fourth step:
Evaluating our model by checking coefficients, the coefficient returns a series which can be used to build a dataframe with our respective features (X) as columns.
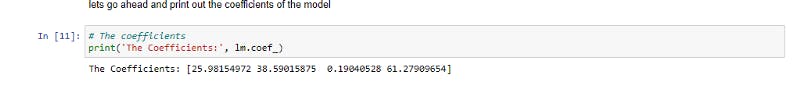
Regression coefficients are estimates of the unknown parameters which describe the relationship between a feature and the label. it tells us if the correlation is positive or negative between the predictor variable (features) called an independent variable and the response(label) called a dependent variable.
Fifth step:
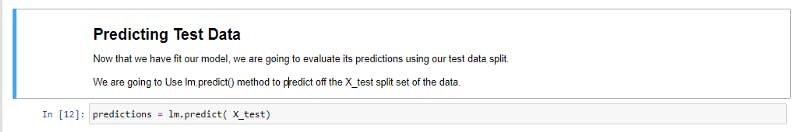
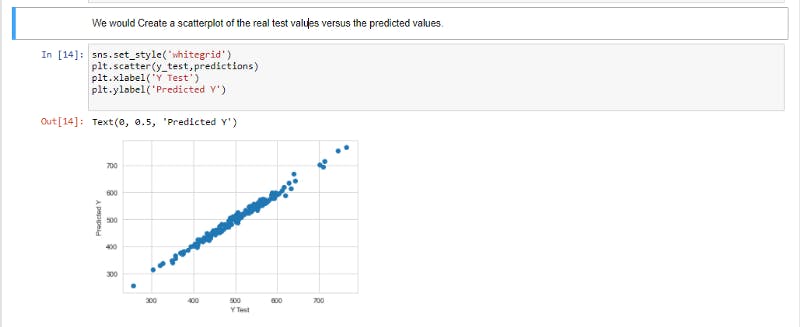
Getting our models predictions off the feature test data (x_test) by using the .predict() method on it, then we go ahead and plot the y_test values against our predictions using scatter plot .
Sixth step:
The goal is for our correlation to be positive for our model to be a great fit.
Correlation between variables indicates that as one variable changes in value, the other variable tends to change in a specific direction.
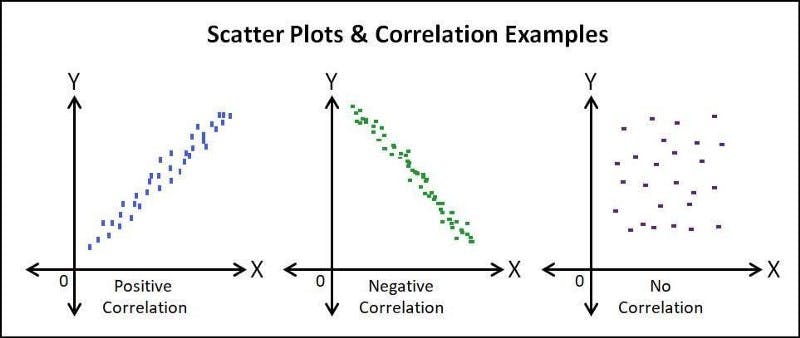 image for correlation
If we happen to get a negative or null correlation we need to go back and adjust our parameters. This is why it is a best practice to always have validation data for that purpose, below is a picture for grasping the importance of correlation.
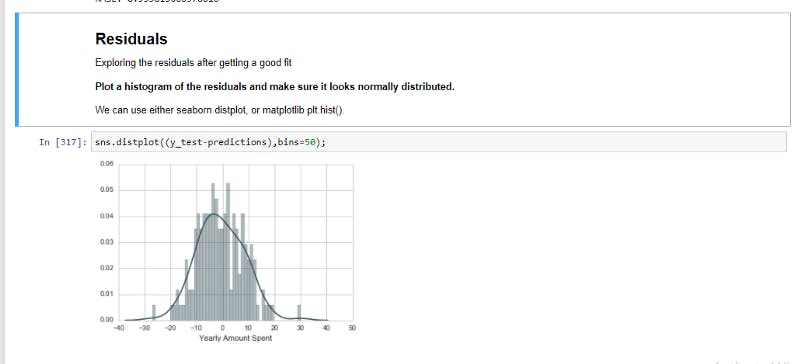
Seventh step:
Visualizing the distribution of our residuals, it's just to make sure our data is uniformly distributed. Residuals is the difference between the actual test values for our label (y_test) and the predicted values(predictions).
Eighth step:
Importing the metrics for evaluating our model performance, we will use the syntax as follows from sklearn import metrics and calculate the three ways we discussed earlier by feeding in the y_test and predictions as arguments.
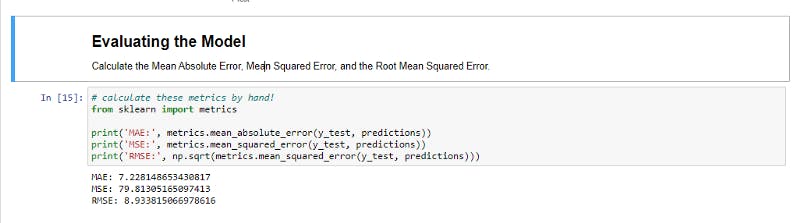
You can read more on the 3 concepts in depth online for better explanation.
Ninth step:
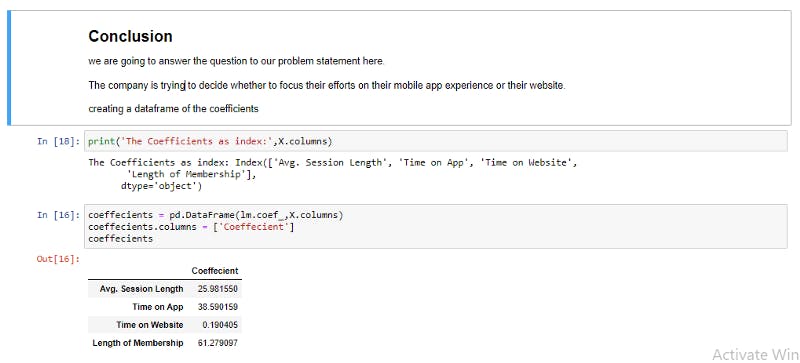
Interpreting Insights we can deduce from the regression coefficients, this is where the answer to the question asked will be answered, The company is trying to decide whether to focus their efforts on their mobile app experience or their website.
Interpreting the coefficients
If all other features are fixed and there is an increase in one unit of a particular feature equals to the value of the coefficient in dollars, in this case we are trying to predict the yearly amount spent.
For example:
If all other fixtures are fixed, a unit increase in Avg. Session Length equals to an increase of 25.98 total dollars spent. If all other features are fixed, a unit increase in Time on Apps Equals to an increase of 38.59 total dollars spent. etc.
RECOMMENDATIONS
From the image above we can clearly see that people spend more using the app $38.590159 compared to time on website $0.190, it makes sense and a good argument to adopt the mobile app as the company mode of interacting with their customers. How about we optimize the website functionalities to match that of the mobile app ,that way we retain customers who love shopping on the website and also attract new customers who prefer shopping on the website, in due time spending on the website will match or even exceed that of the app. This is a link to the GitHub repo for this Articles, it contains the files and code in the article. Enjoy.
CONCLUSIONS
Congratulations if you've followed me on this exciting ride, I hope you Learnt a thing or more about how we can use machine learning to improve experiences around us. As a continuation to this article I will be working back and forward writing more content on pandas and Exploratory Data Analysis(EDA),how to identify, create and use the right visualization techniques using python and Tableau the talk about more machine learning techniques. I want you to join me on this journey and connect with me on :
Cheers !!.